Winchart Technical Analysis
Daily Market analysis

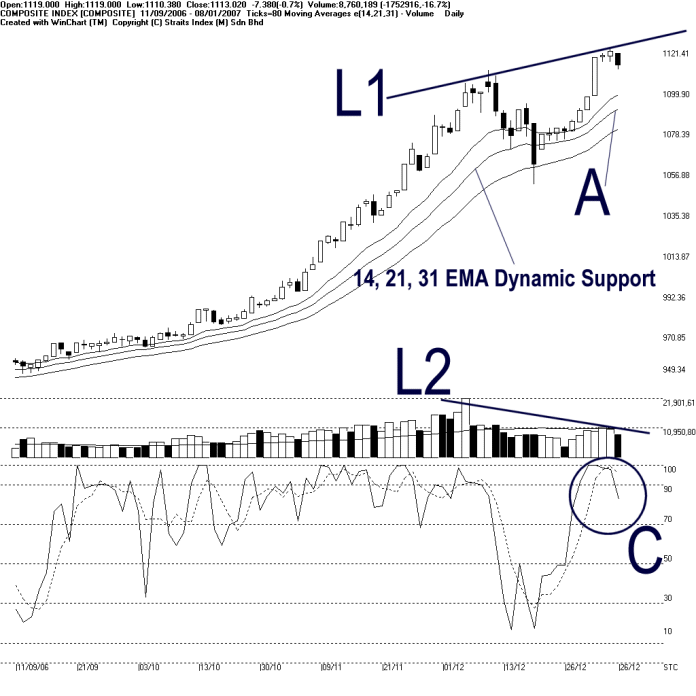
As shown on the chart above, the KLCI ended lower on Monday, technically corrected 7.38 points to close at 1113.02 points. At the moment, the immediate resistance of the KLCI is seen at 1121.41 point; and the technical correction is likely to continue, with the support at the 14, 21, 31 EMA dynamic support.. If the KLCI could be supported by the 14, 21, 31 EMA, the outlook for the KLCI remained positive bias. (Study A)
As shown by L1 and L2, the KLCI had a volume divergence signal where the KLCI made a higher peak but volume, on the other hand, failed to break above the previous peak. This suggested that the market participation or the inflow of market capital was relatively insufficient to support the new high. Therefore, at the moment, the sustainability of the bullishness is still questionable. Nevertheless, the KLCI is likely to stay in a correction stage and no bearish trend has been sighted for the KLCI is still supported by the dynamic support. (Study L1 and L2)
%K of Stochastic fell below 90% level, suggested a technical correction for the KLCI. Provided that the stochastic could remained above the 70% level, the market movement for the short-term is still bullish bias. (Study C)
Find this analysis useful? Why not share it with others? Click Here to send this to a friend
 1st Online Training In Malaysia |
 |
 |
 |
| View the Online Training | More Market Analysis | Find out more about WinChart | Upcoming Events |
Straits Index (M)
Sdn Bhd
No. 16, Jalan LP 1A / 5, Lestari Perdana,
43300 Seri Kembangan, Selangor
Hotline: (03) 8941 6828 (5
lines) Fax: (03) 8941 9828
Email: info@straitsindex.com
© Copyright 1997-2007 Straits Index (M) Sdn Bhd All
rights reserved