Winchart Technical Analysis
Daily Market analysis

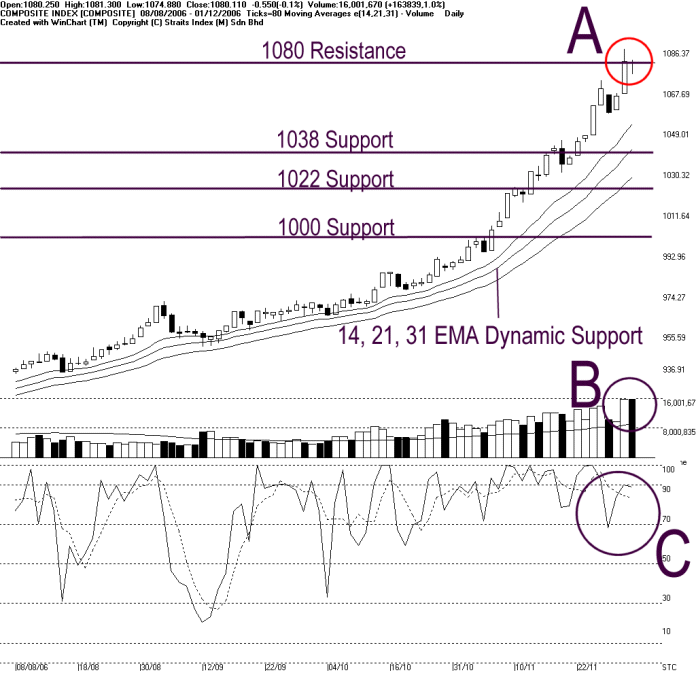
KLCI retested the 1080 resistance and close precisely at 1080.11 point on Friday, suggested that the 1080 is still the resistance to the KLCI. (Study A) If the KLCI failed to break above the 1080 resistance, the KLCI would go through another consolidation and the support would be at the rising 14, 21, 31 EMA dynamic support. Nevertheless, other supports are seen at 1038, 1022 and 1000 points.
Total market volume increased 1% on Friday. However, with the KLCI testing the resistance, a high volume would suggested that the resistance is confirmed, which reinforced the strength of the resistance level. Nevertheless, if the volume could maintain above the 40 days VMA level after the correction, the bullish sentiment is likely to continue. (Study B)
Nothing much changes in the Stochastic, with both lines still situated above the 70% level, short-term bullish region. If the KLCI were to retreat and consolidation, expect a decline in both %K and %D lines and if %K fell below 70% level, that would be the first signal suggested an end to the short-term bullish movement, and confirmation comes when the %D fell below 70% level. (Study C)
Find this analysis useful? Why not share it with others? Click Here to send this to a friend
 1st Online Training In Malaysia |
 |
 |
 |
| View the Online Training | More Market Analysis | Find out more about WinChart | Upcoming Events |
Straits Index (M)
Sdn Bhd
No. 16, Jalan LP 1A / 5, Lestari Perdana,
43300 Seri Kembangan, Selangor
Hotline: (03) 8941 6828 (5
lines) Fax: (03) 8941 9828
Email: info@straitsindex.com
© Copyright 1997-2006 Straits Index (M) Sdn Bhd All
rights reserved