Winchart Technical Analysis - Daily Market analysis
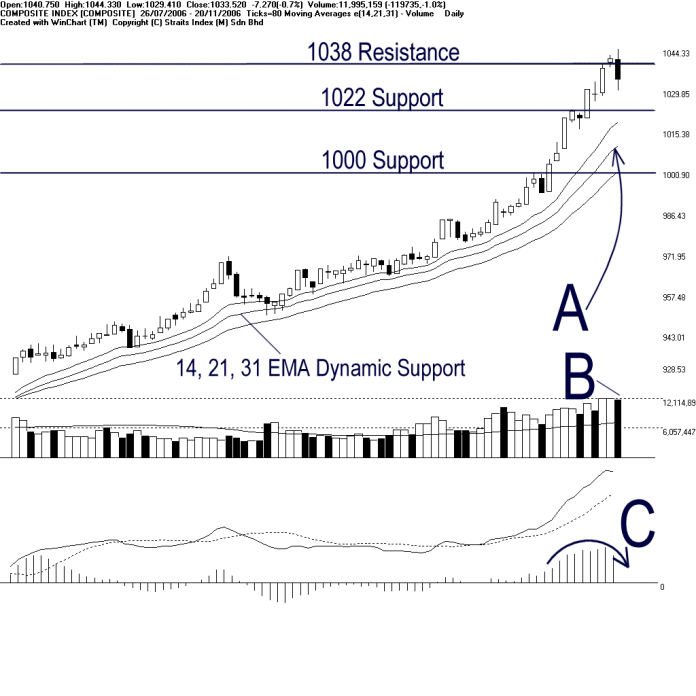
KLCI technically corrected 7.27 points, closing the trading day at 1033.52 points. As shown by the chart above, the 1038 level is still the resistance to the KLCI while supports are seen at 1022 level and 1000 level respectively. Mean while, as pointed by A, the 14, 21, 31 EMA remained rising and continue serving as the dynamic support to the KLCI. Therefore, provided that the KLCI is still supported by the dynamic support, outlook for the KLCI is still positive.
Total market volume on Monday was almost unchanged, with nearly 1.2 billion shares traded. As pointed by A, total market volume remained higher above the 40 days VMA level which suggested that the market was still wide participated. However, if the KLCI were to continue in its consolidation, a decline in volume in generally viewed as a healthy sign. Nonetheless, if the KLCI were to re-test the 1038 or 1040 level, a significant increase of volume is imperative. (Study B)
In line with the correction of the KLCI, the MACD histogram ticked down and formed a rounding top. This suggested a short-term technical correction signal also suggested a weakening bullish signal. This short-term correction condition shall continue until the histogram started to tick up and formed a rounding bottom. At the moment, the MACD has not triggered any bearish signal. (Study C)
Find this analysis useful? Why not share it with others? Click Here to send this to a friend
Straits Index (M)
Sdn Bhd
No. 16, Jalan LP 1A / 5, Lestari Perdana,
43300 Seri Kembangan, Selangor
Hotline: (03) 8941 6828 (5
lines) Fax: (03) 8941 9828
Email: info@straitsindex.com
© Copyright 1997-2006 Straits Index (M) Sdn Bhd All
rights reserved