Winchart Technical Analysis - Daily Market analysis
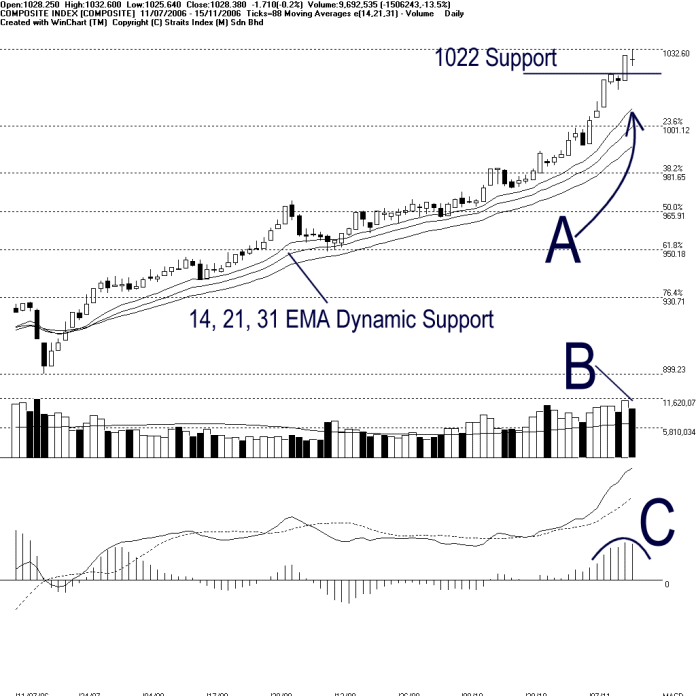
KLCI ended mixed on Wednesday after attempted yet another intra-day new high at 1032.60 points. As shown on the chart above, the 1022 point is still the immediate support to the KLCI while the rising 14, 21, 31 EMA is still serving as the dynamic support to the KLCI. Immediate resistance for the KLCI is seen at 1038 points. Provided that the KLCI could remained supported by the rising dynamic support, the uptrend of the KLCI shall continue. (Study A)
Total market volume declined 13.5% in respond to the technical correction of the KLCI. However, volume remained higher above the 40 days VMA level, which suggested that the market was still actively participated. If the KLCI uptrend were to continue, volume above the 40 days VMA is the crucial element. (Study B)
As indicated by the C curve, the MACD histogram turned down in respond to the technical correction. The histogram formed a rounding top, which suggested a weakening of the MACD bullish signal. This indicates that the KLCI short-term movement is likely consolidate, and provided that the MACD line does not cross below the trigger line, no bearish signal would be triggered. (Study C)
Find this analysis useful? Why not share it with others? Click Here to send this to a friend
Straits Index (M)
Sdn Bhd
No. 16, Jalan LP 1A / 5, Lestari Perdana,
43300 Seri Kembangan, Selangor
Hotline: (03) 8941 6828 (5
lines) Fax: (03) 8941 9828
Email: info@straitsindex.com
© Copyright 1997-2006 Straits Index (M) Sdn Bhd All
rights reserved