Winchart Technical Analysis - Daily Market analysis
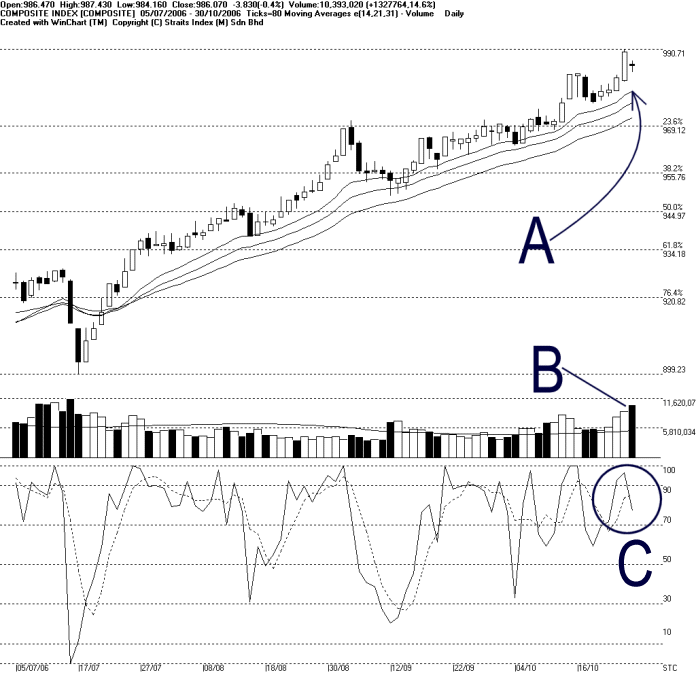
A technical correction took place on Monday, and the KLCI ended lower to 986.07 points, losing 3.83 points. As pointed by A, the rising 14, 21, 31 EMA remained as the dynamic support to the KLCI while the immediate resistance is at 990.71 Fibonacci Retracement. (Study A)
As pointed by B, total market volume on Monday gained 14.6% with more than 1 billion shares traded. This suggested that the market was indeed active. However, it is usually a better sign if the volume would retreat during a correction stage, therefore, if the volume remained high while the KLCI remained resisted, it would strengthen the resistance, unless the KLCI could break above the 990.71 barrier with strong volume. (Study B)
Despite the technical correction, Stochastic remained above 70% level, suggested that the market movement for the short-term is still bullish. If Stochastic dropped below this level, it would suggest an end to the short-term bullishness to neutral. (Study C)
Find this analysis useful? Why not share it with others? Click Here to send this to a friend
Straits Index (M)
Sdn Bhd
No. 16, Jalan LP 1A / 5, Lestari Perdana,
43300 Seri Kembangan, Selangor
Hotline: (03) 8941 6828 (5
lines) Fax: (03) 8941 9828
Email: info@straitsindex.com
© Copyright 1997-2006 Straits Index (M) Sdn Bhd All
rights reserved