Winchart Technical Analysis - Daily Market analysis
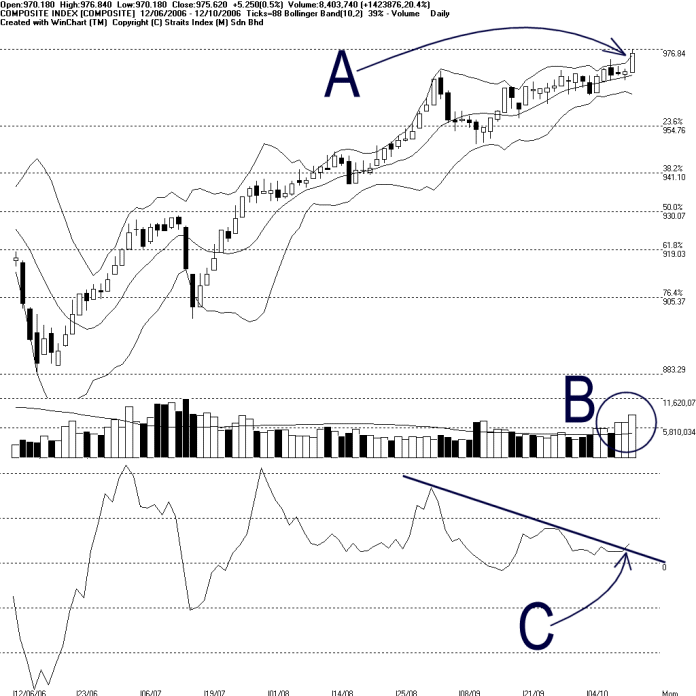
KLCI broke out of the 970 resistance successfully on Thursday, ended the day at 975.62, up 5.25 points. As pointed by A, Bollinger Bands width expanded 39% with the KLCI above the Bollinger middle band, therefore, suggested a bullish signal. Besides the rising 14, 21, 31 EMA, the Bollinger middle band could also used as a dynamic support to the KLCI. If the Bollinger Band width could remained expanding, the bullish signal of the KLCI is expected to continue.
Due to a new high break out of the KLCI, there is no visible immediate resistance for the KLCI. However, the next major resistance for the KLCI is seen at 1021 level.
As circled by B, total market volume on Thursday gained 20.4% and clearly stood above the 40 days VMA level. This suggested that the market was indeed well-participated and also implied some inflow of market capital. In addition, the increasing of volume also confirmed the break out of the KLCI. Therefore, in order for the KLCI to remained bullish, volume above the 40 days VMA is crucial. (Study B)
As pointed by C. Momentum broke above the descending line and canceled out the Divergence warning signal. (Study C)
Find this analysis useful? Why not share it with others? Click Here to send this to a friend
Straits Index (M)
Sdn Bhd
No. 16, Jalan LP 1A / 5, Lestari Perdana,
43300 Seri Kembangan, Selangor
Hotline: (03) 8941 6828 (5
lines) Fax: (03) 8941 9828
Email: info@straitsindex.com
© Copyright 1997-2006 Straits Index (M) Sdn Bhd All
rights reserved