Winchart Technical Analysis - Daily Market analysis
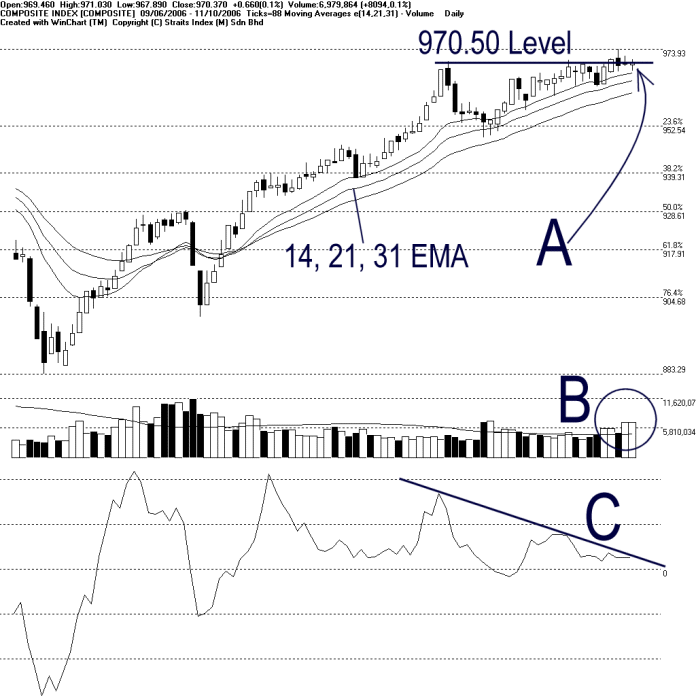
As pointed by A, the 970.5 remained as the resistance level while the rising 14, 21, 31 EMA is still serving as the dynamic support. (Study A) As a result, the KLCI is trading in a narrow range. Nevertheless, with the KLCI still supported by the 14, 21, 31 EMA, market outlook is still on the bullish bias.
Total market volume remained above the 40 days VMA suggested that the market was still well-participated. Therefore, in general, if the volume could maintain above the 40 days VMA level, market is likely to be resilient. (Study B)
Momentum remained below the descending line ever since the appearance of the Class-A divergence signal. Therefore, this remains as a warning signal suggested a weakness in the KLCI movement. Momentum must break above the descending line successfully in order to cancel out the Class-A divergence warning. (Study C)
Find this analysis useful? Why not share it with others? Click Here to send this to a friend
Straits Index (M)
Sdn Bhd
No. 16, Jalan LP 1A / 5, Lestari Perdana,
43300 Seri Kembangan, Selangor
Hotline: (03) 8941 6828 (5
lines) Fax: (03) 8941 9828
Email: info@straitsindex.com
© Copyright 1997-2006 Straits Index (M) Sdn Bhd All
rights reserved