Winchart Technical Analysis - Daily Market analysis
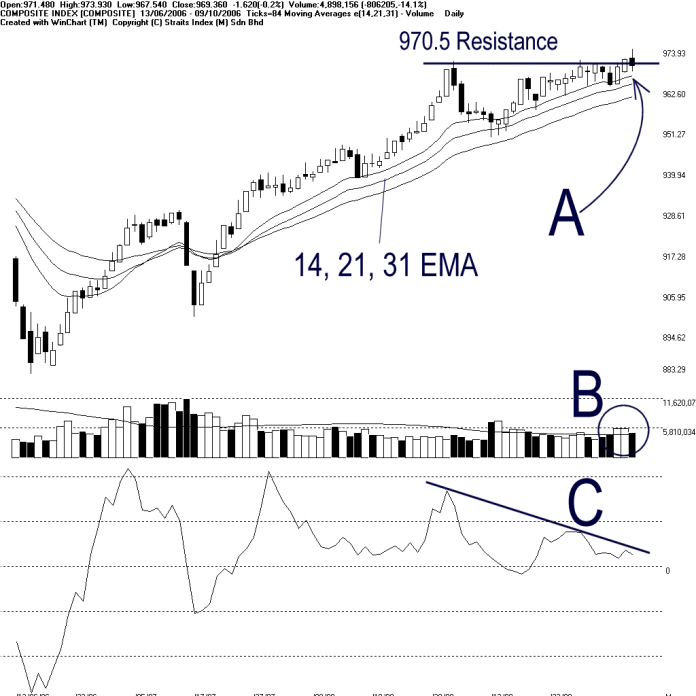
KLCI made another intra-day new high at 973.93; however, closed lower at 969.38 points. Therefore, the breakout of the 970.50 resistance level is still yet to be confirmed. As pointed by A, the 14, 21, 31 EMA remained rising and continue serving as the dynamic support to the KLCI. As long as the KLCI is still supported by the rising EMA, the uptrend of the KLCI is likely to continue. (Study A)
Total market volume retreated 14.1% on Monday as the KLCI was having a technical correction. However, the market volume remained higher above the 40 days VMA level, suggested that the market participation was relatively sufficient. Therefore, provided that the volume could stay above the 40 days VMA level, outlook for the KLCI is likely to stay positive. (Study B)
Despite the KLCI making new high, the class-A bearish divergence of Momentum was still intact. This suggested a weakness on the KLCI and if the Momentum could not break above the descending line, there is a chance for more technical correction of the KLCI. (Study C)
Find this analysis useful? Why not share it with others? Click Here to send this to a friend
Straits Index (M)
Sdn Bhd
No. 16, Jalan LP 1A / 5, Lestari Perdana,
43300 Seri Kembangan, Selangor
Hotline: (03) 8941 6828 (5
lines) Fax: (03) 8941 9828
Email: info@straitsindex.com
© Copyright 1997-2006 Straits Index (M) Sdn Bhd All
rights reserved