Winchart Technical Analysis - Daily Market analysis
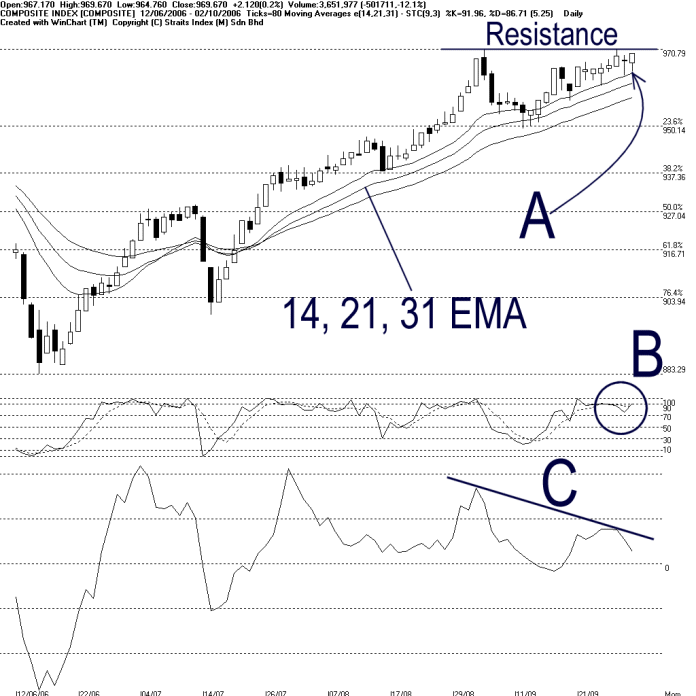
Once again, as pointed by A, the KLCI rebounded from the 14 days EMA dynamic support, and this has again suggesting that the 14, 21, 31 EMA is still serving as the dynamic support to the KLCI. (Study A) Despite the rising support from the 14, 21, 31 EMA, we still see an important resistance at the 970.79 Fibonacci Retracement. This would remained as an important resistance for the KLCI for if the KLCI was still resisted by this level, the upside room is still limited.
Both the %D and %K line of the Stochastic are showing a short-term bullish signal, with both lines situated above the 70% level. Therefore, provided that the Stochastic could maintain its position above the 70% level, market sentiment for the short-term is still bullish. (Study B)
As mentioned in last Friday's analysis, the Class B bearish divergence signal from the Momentum is still intact. Momentum must break above the descending line C, or else, the class B divergence signal is still suggesting a weakness in the KLCI. (Study C)
Find this analysis useful? Why not share it with others? Click Here to send this to a friend
Straits Index (M)
Sdn Bhd
No. 16, Jalan LP 1A / 5, Lestari Perdana,
43300 Seri Kembangan, Selangor
Hotline: (03) 8941 6828 (5
lines) Fax: (03) 8941 9828
Email: info@straitsindex.com
© Copyright 1997-2006 Straits Index (M) Sdn Bhd All
rights reserved