Winchart Technical Analysis - Daily Market analysis
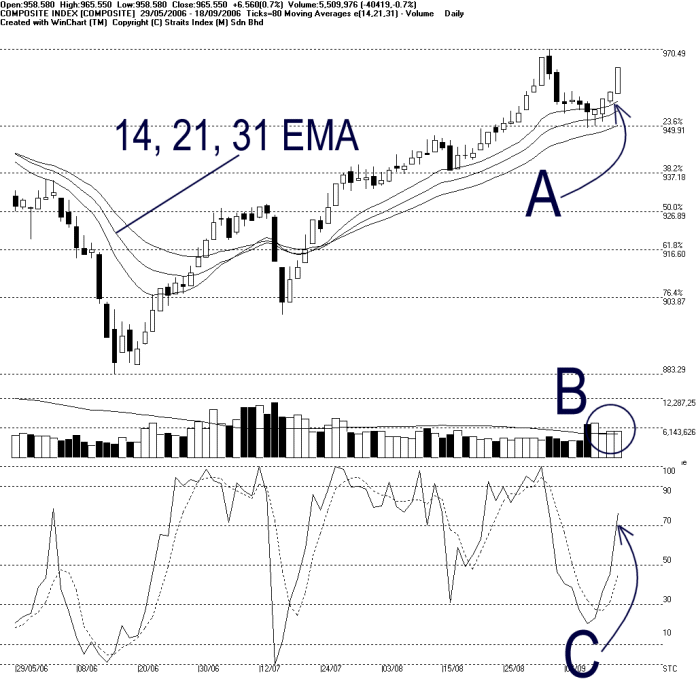
KLCI ended higher on Monday, after successfully rebounded from the 14, 21, 31 EMA dynamic support. As indicated by A, the 14, 21, 31 EMA is now continue serving as the dynamic support to the KLCI. As long as the KLCI is being supported by the 14, 21, 31 EMA, outlook would likely to stay bullish. In addition to the EMA, 950 is also another support of the KLCI while the resistance is still at 970.49 Fibonacci Retracement.
Total market volume on Monday almost unchanged. Volume managed to stay above the 40 days VMA level suggested that the market participation was relatively sufficient. Therefore, if the volume could increase while the KLCI testing the 970.49 Fibonacci Retracement, chance for the KLCI breaking the 970 is higher. (Study B)
%K of the Stochastic has breached above the 70% level on Monday, triggered the 1st short-term bullish signal. If the %D line could break above the 70% level, it would confirm the %K signal. As long as both lines of the Stochastic could stay above 70% level, market sentiment for the short-term is expected to be bullish. (Study C)
Find this analysis useful? Why not share it with others? Click Here to send this to a friend
Straits Index (M)
Sdn Bhd
No. 16, Jalan LP 1A / 5, Lestari Perdana,
43300 Seri Kembangan, Selangor
Hotline: (03) 8941 6828 (5
lines) Fax: (03) 8941 9828
Email: info@straitsindex.com
© Copyright 1997-2006 Straits Index (M) Sdn Bhd All
rights reserved