Winchart Technical Analysis - Daily Market analysis
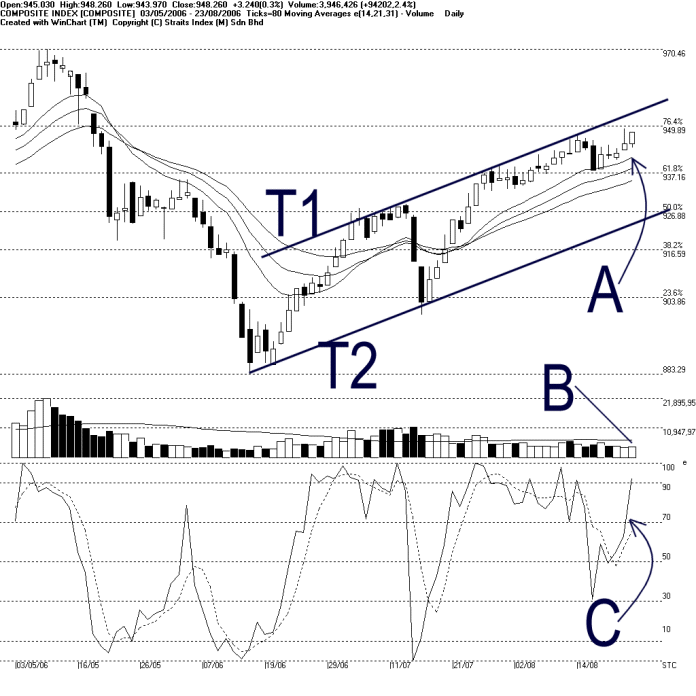
KLCI ended higher on Wednesday, gaining 3.24 points to 948.26 points. As pointed by A, 14, 21, 31 EMA remained rising and at the mean time continue serving as the dynamic support to the KLCI. Mean while, T1 and T2 up trend channel shall remained intact. Immediate resistance of the KLCI is now seen at the 949.89 Fibonacci Retracement or 950 level.
The KLCI ended higher again with low volume, with volume stood at only about 394 million shares. Total market volume remained below the 40 days VMA level, suggested that the market was really lightly participated, thus lack of capital in-flow. (Study B)
Despite the lackluster market involvement, Stochastic %K breached above the 70% level on Wednesday's closing, triggered the first bullish signal. If the %D could break above the 70% level, market sentiment for the short-term is likely to turn bullish bias. (Study C)
Straits Index (M)
Sdn Bhd
No. 16, Jalan LP 1A / 5, Lestari Perdana,
43300 Seri Kembangan, Selangor
Hotline: (03) 8941 6828 (5
lines) Fax: (03) 8941 9828
Email: info@straitsindex.com
© Copyright 1997-2006 Straits Index (M) Sdn Bhd All
rights reserved