Winchart Technical Analysis - Daily Market analysis
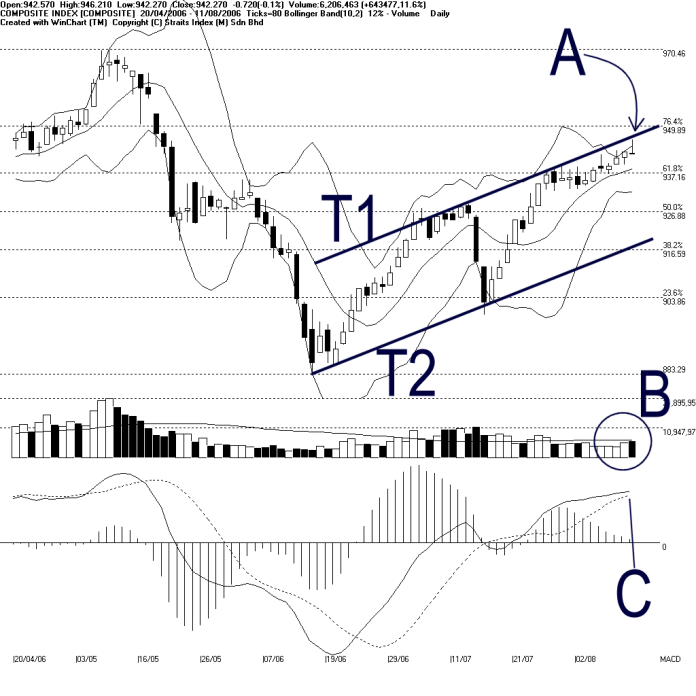
The KLCI had an early gain on Friday, but ended flat, losing 0.72 of a point. As pointed by A, the KLCI was resisted by the T1 ascending trending channel dynamic resistance. Mean while, the Bollinger Band width expanded another 12% while the KLCI remained above the Bollinger middle band. Therefore, the Bollinger middle band would now be serving as the dynamic support to the KLCI. (Study A)
Volume on Friday gained 11.6%, getting very closed to the 40 days VMA level. This suggested an improved market participation thus improved the market liquidity. However, with the KLCI ended mixed with a long upper shadow line, the higher volume could suggested, on the other hand, a bearish reversal. Therefore, it is crucial for the KLCI to be supported by the Bollinger middle band. (Study B)
As pointed by C, MACD line is moving closing to the trigger line, but as of Friday's closing, no bearish signal has been triggered yet. Nevertheless, MACD histogram failed to tick up suggested that the bullish signal was still weakening. (Study C)
Straits Index (M)
Sdn Bhd
No. 16, Jalan LP 1A / 5, Lestari Perdana,
43300 Seri Kembangan, Selangor
Hotline: (03) 8941 6828 (5
lines) Fax: (03) 8941 9828
Email: info@straitsindex.com
© Copyright 1997-2006 Straits Index (M) Sdn Bhd All
rights reserved