Winchart Technical Analysis - Daily Market analysis
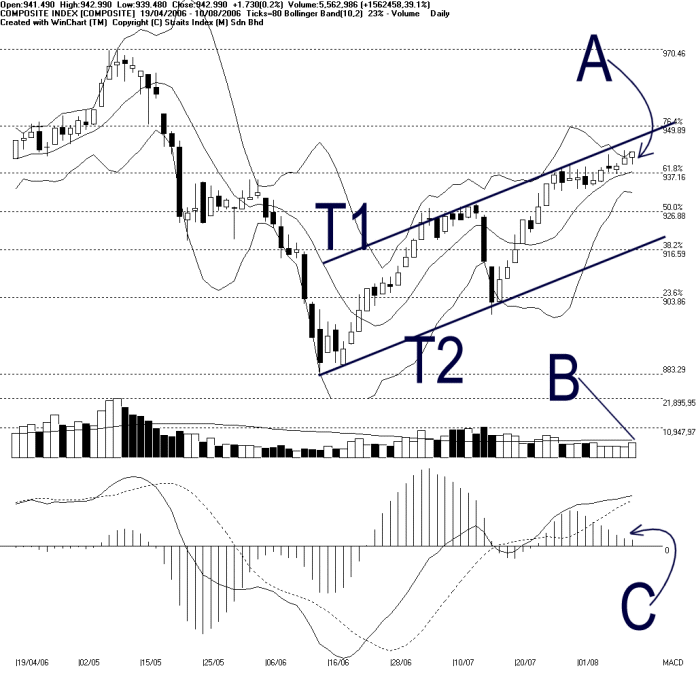
As indicated by A, KLCI ended marginally higher on Thursday with the Bollinger Band width expanding 16%. With the KLCI situated above the Bollinger middle band, outlook for the KLCI is likely to be bullish bias. Nevertheless, 10 days Bollinger middle band will continue to serve as the dynamic support for the KLCI while the immediate resistance would be at the T1 uptrend dynamic resistance line. (Study A)
Volume on Thursday increased 39.1% and getting closer to the 40 days VMA level. This suggested a signal of improvement in the market participation. If the growth of volume could continue and stay above the 40 days VMA, the bullishness of the KLCI would likely to continue. (Study B)
As indicated by C, the MACD histogram almost stop declining suggested that the bullish MACD signal might continue. If the MACD histogram started ticking up, it would suggest that the short-term market sentiment would improve. (Study C)
Straits Index (M)
Sdn Bhd
No. 16, Jalan LP 1A / 5, Lestari Perdana,
43300 Seri Kembangan, Selangor
Hotline: (03) 8941 6828 (5
lines) Fax: (03) 8941 9828
Email: info@straitsindex.com
© Copyright 1997-2006 Straits Index (M) Sdn Bhd All
rights reserved