Winchart Technical Analysis - Daily Market analysis
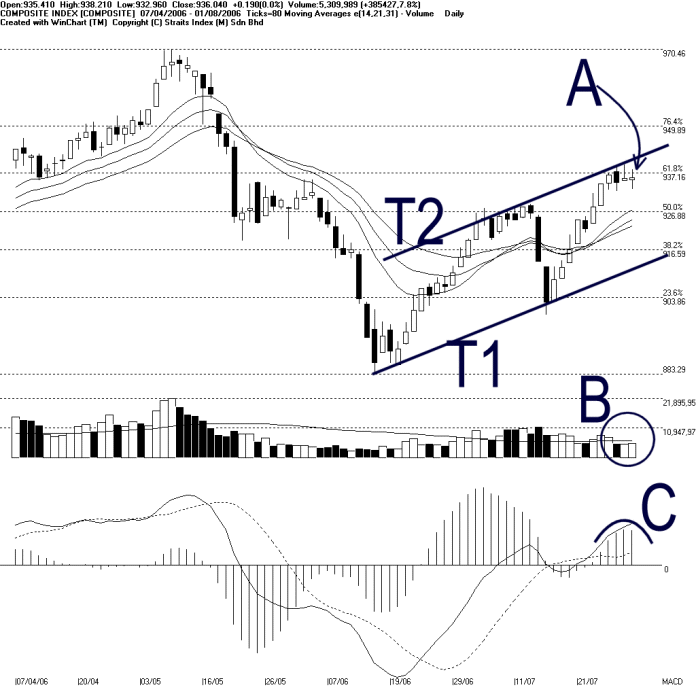
Consolidation of the KLCI continued on Tuesday with the KLCI ended mixed. As shown on the chart above, the KLCI was still resisted by the 937.16 Fibonacci Retracement resistance. (Study A) Mean while, for the support side, 14, 21, 31 EMA shall remain as the immediate support and the next support would be at T1 ascending trend line.
As circled by B, total market volume continued to stay below the 40 days VMA level on Tuesday, suggested that the market participation was still relatively insufficient. However, during this consolidation, a lower volume is usually a healthy sign. (Study B)
MACD histogram ticked down for the first time since the MACD triggered a bullish signal on 25th of July. This suggested that the bullish signal is weakening, thus a sign of a technical correction or consolidation. This consolidation signal shall continue until the histogram started to tick up again. (Study C)
Straits Index (M)
Sdn Bhd
No. 16, Jalan LP 1A / 5, Lestari Perdana,
43300 Seri Kembangan, Selangor
Hotline: (03) 8941 6828 (5
lines) Fax: (03) 8941 9828
Email: info@straitsindex.com
© Copyright 1997-2006 Straits Index (M) Sdn Bhd All
rights reserved