Winchart Technical Analysis - Daily Market analysis
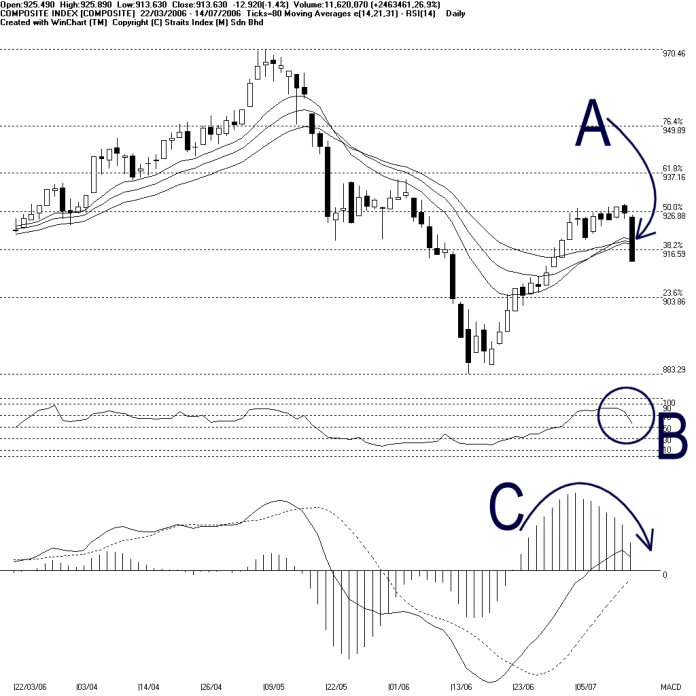
As indicated by A, the KLCI fell below the 14, 21, 31 EMA as well as the 916.59 Fibonacci Retracement support on Friday. Generally, the down fall on Friday was too big for a technical correct, and as a result, it has dampen the market sentiment. With the EMA moving flat, market direction is at mixed. Unless the KLCI could return to above the EMA in the near future, or else, the EMA would be serving as the dynamic resistance and the market outlook would turn to bearish. (Study A)
As circled by B, WinChart RSI lost its position at the bullish region, suggested that the mid-term bullish sentiment has ended. At the moment, market sentiment for the mid-tern is at neutral. (Study B)
MACD histogram continued falling on Friday, and the MACD line also started pointing downward. Therefore, this indicated that the market direction might be turning bearish, even though the MACD has not triggered any bearish signal. (Study C)
Straits Index (M)
Sdn Bhd
No. 16, Jalan LP 1A / 5, Lestari Perdana,
43300 Seri Kembangan, Selangor
Hotline: (03) 8941 6828 (5
lines) Fax: (03) 8941 9828
Email: info@straitsindex.com
© Copyright 1997-2006 Straits Index (M) Sdn Bhd All
rights reserved