Winchart Technical Analysis - Daily Market analysis
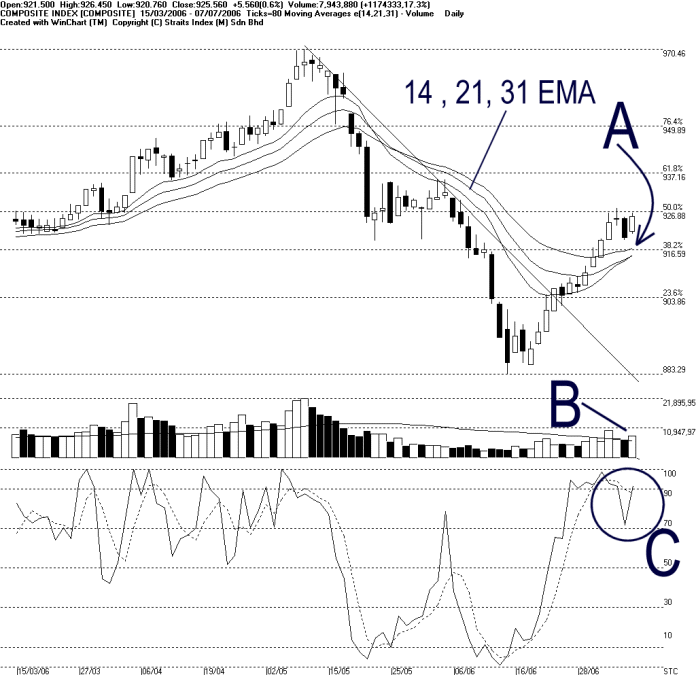
On Friday, the KLCI retested the 926.88 Fibonacci Retracement resistance; but failed to take out the resistance again. At the close, the KCLI ended 5.56 point higher, staying above 14, 21 31 EMA dynamic support while still in the consolidation. (Study A)Therefore, the KLCI is still in a tight congestion region between the 926.88 Fibonacci Retracement resistance and the 916.59 Fibonacci Retracement as well as the 14, 21, 31 EMA.
Volume on Friday almost touching the 800 million level, gaining 17.3%. As pointed by B, total market volume on Friday was above the 40 days VMA level, which suggested that the market was relatively well-participated. For the KLCI to break above the 926.88 resistance and perhaps continue its upward momentum, an increase of volume is absolutely important. (Study B)
As shown by the C circle, Stochastic remained above the 70% bullish region, which suggested that the market sentiment for the short-term is still bullish. (Study C)
Straits Index (M)
Sdn Bhd
No. 16, Jalan LP 1A / 5, Lestari Perdana,
43300 Seri Kembangan, Selangor
Hotline: (03) 8941 6828 (5
lines) Fax: (03) 8941 9828
Email: info@straitsindex.com
© Copyright 1997-2006 Straits Index (M) Sdn Bhd All
rights reserved