02/12/2005
 (M)
Sdn Bhd
(M)
Sdn Bhd All Rights Reserved.
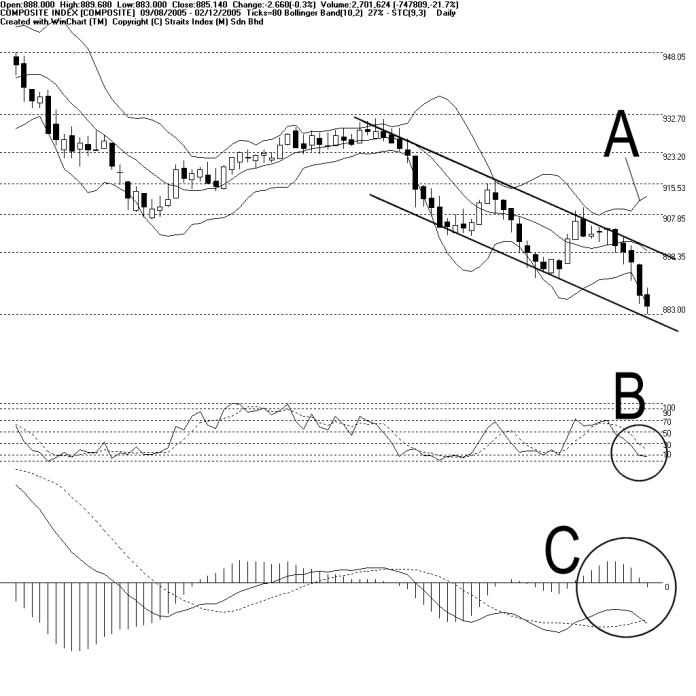
The Composite Index ended lower again, losing 2.66 points to 885.14 points. As shown on the chart above, KLCI remains in the down trend channel, with the T1 as the dynamic resistance and T2 as the dynamic support.
Mean while, the 10 days Bollinger band width expanded 27% suggesting that the downside risk for KLCI is still high. However, the KLCI has partially breached below the 20 days lower band, therefore, it suggests that the KLCI might be having a pull back effect in the short-term. (Study A)
As shown in the B circle, the Stochastic remained in the short-term bearish zone. As a result, market sentiment for the short-term is expected to be bearish bias until the %K line breaks above the 30% level. (Study B)
As indicated by C, the MACD histogram is still heading south, giving no implication that the market is having a technical rebound. Market sentiment remains bearish until a visible round bottom signal from the histogram, which would then suggests a short-term technical rebound. (Study C)
Copyright 1997-2005 Straits Index (M) Sdn Bhd, All Rights Reserved