28/10/2005
 (M)
Sdn Bhd
(M)
Sdn Bhd All Rights Reserved.
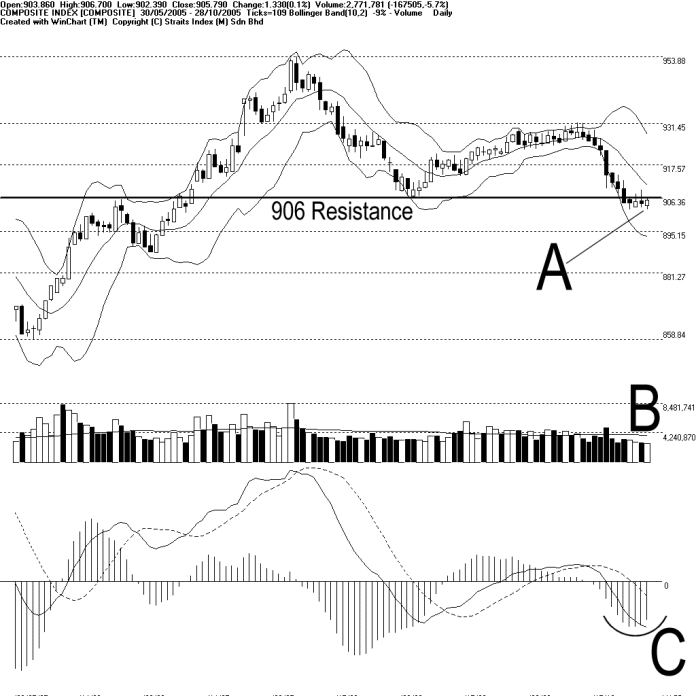
Composite Index ended the Friday trading mixed, gaining 1.33 points to 905.79 points. As shown on the chart above, KLCI is still resisted by the 906 Fibonacci retracement line. At the same time, 10 days Bollinger band width continue to contract 9%, and indeed, the KLCI is consolidating. In additional, 10 days Bollinger middle band also serves as a dynamic resistance for KLCI. (Study A)
As indicated in B, total market volume on Friday was only at 2.77 million lots, while failing to reach the 40 days VMA level. This is mostly due to the upcoming long holidays of Bursa Malaysia. (Study B)
MACD histogram continue to tick higher and the round bottom signal continues; as a result, the KLCI consolidates. Consolidation is expected to continue until a visible round top signal is formed on the histogram. (Study C)
Copyright 1997-2005 Straits Index (M) Sdn Bhd, All Rights Reserved