17/06/2005
 (M)
Sdn Bhd
(M)
Sdn Bhd All Rights Reserved.
Composite Index Daily Technical Analysis, 17/06/2005
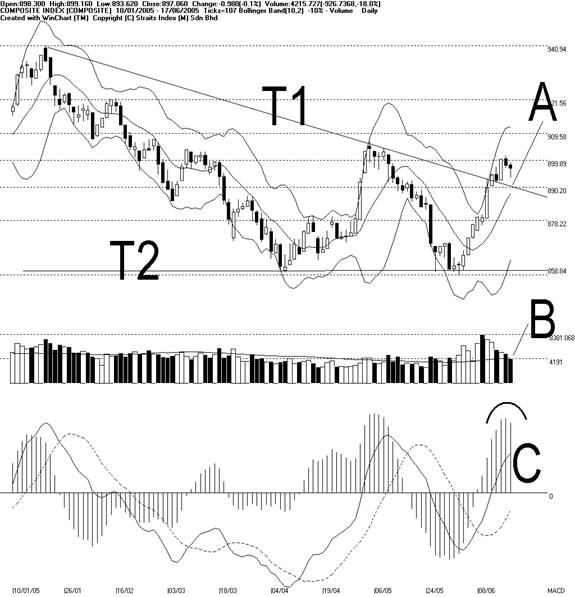
Composite Index closed mixed with a decline of 0.98 points, closing the week at 897.06 points. As presented on the chart, KLCI again was resisted at the 899.89 WinChart automatic Fibonacci Retracement line while still supported by the T1 dynamic support as well as the 890.2 WinChart automatic Fibonacci Retracement line. (Refer to A)
Driven by the low volatility of the market, 10 days Bollinger Bands contracted 10%. Nevertheless, KLCI remained above the middle band thus immediate out look of KLCI is still in flavor. Total market volume, however, was rather disappointed with a decreased of another 18% on Friday. Volume on Friday was below the 40 days VMA. (Refer to B)
MACD histogram on Friday ticked lower thus triggered a round-top signal, suggesting that the KLCI is having a technical correction. Readers are to take note that a technical correction does not necessary mean a decline for the market. In fact, in our opinion the best correction or consolidation is the side-ways market. (Refer to C)
Copyright 1997-2005 Straits Index (M) Sdn Bhd, All Rights Reserved