14/06/2005
 (M)
Sdn Bhd
(M)
Sdn Bhd All Rights Reserved.
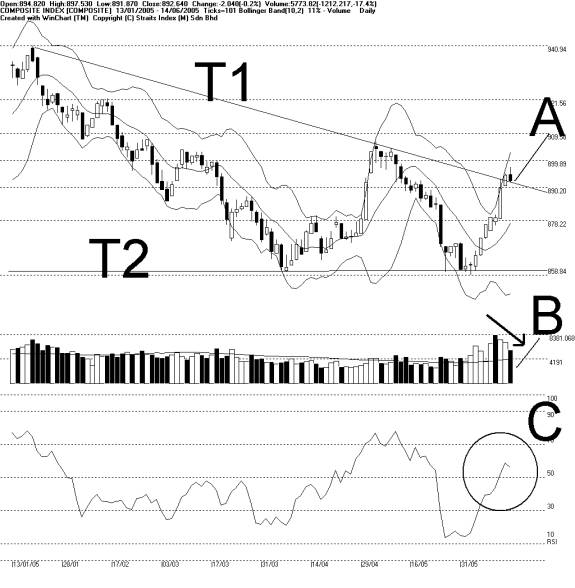
As mentioned on yesterdays analysis, KLCI indeed had a
technical correction but amazingly supported by the T1 dynamic support.
Therefore, T1 remains a crucial support line, as well as the 890.22 points of
the WinChart automatic Fibonacci Retracement. As for the resistance, it is still
located at 899.89 points of the WinChart automatic Fibonacci Retracement line.
(Refer to A)
As shown in B, total market volume has again decreased
17.4% while still standing above the 40 days VMA. Nonetheless, if KLCI were
continue its upward momentum, market volume higher than the 40 days VMA is
imperative.
Despite the flamboyant performance of KLCI lately, WinChart RSI has never shown any sign of bullish market sentiment. Nevertheless, WinChart RSI is currently located slightly above the 50% level, mid-term neutral zone, giving no clear signals of any bullish market sentiment.
Copyright 1997-2005 Straits Index (M) Sdn Bhd, All Rights Reserved