07/06/2005
 (M)
Sdn Bhd
(M)
Sdn Bhd All Rights Reserved.
Composite Index
Daily Technical Analysis, 07/06/2005
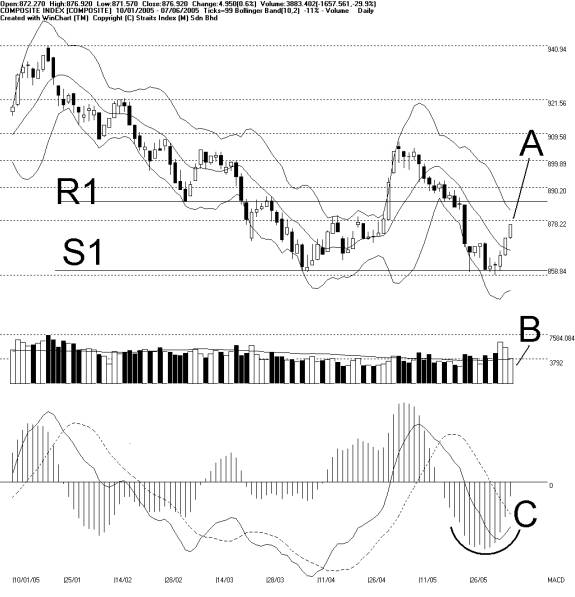
KLCI ended firmly on Tuesday with a gain of 4.95 points. 10
days Bollinger Bands contracted 11%, still giving no signal for KLCI next
direction. Nevertheless, KLCI stayed above the important 860 S1 level, while
approaching to the R1 resistance as well as the 878.22 WinChart automatic
Fibonacci Retracement line. Therefore, selling pressure is likely to step in and
interrupt the upward movement temporary. (Refer to A).
Indicated in B, although total market volume has once again
above the 40 days VMA, it has been reduced drastically, if compared to the
previous two trading days. This shows that the participation of the market
activities has decreased.
Copyright 1997-2005 Straits Index (M) Sdn Bhd, All Rights Reserved