30/05/2005
 (M)
Sdn Bhd
(M)
Sdn Bhd All Rights Reserved.
Composite Index
Daily Technical Analysis, 30/05/2005
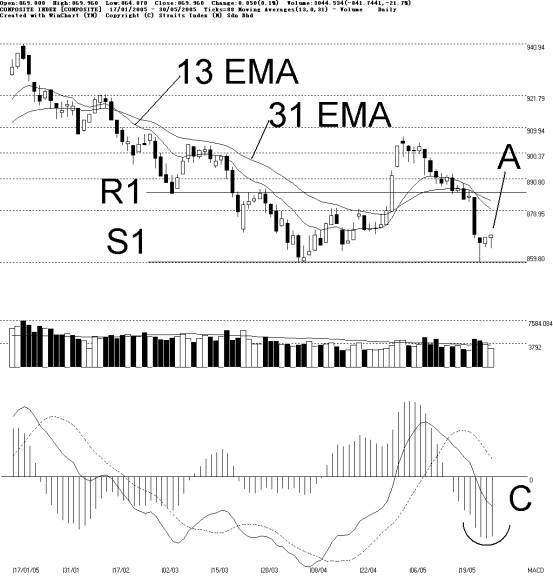
KLCI closed mixed on Monday at 869.96 points, up only 0.85
points. Support for KLCI remained at S1 at 859.8, which is also the WinChart
Automatic Fibonacci Retracement line, while the resistance is at the 874.51
WinChart Automatic Fibonacci Retracement as well as the R1 resistance line.
Furthermore, 13 days EMA, as well as the 10 days Bollinger Middle Band also
serve as KLCIs dynamic resistances. (Refer to A).
Total market volume traded on Monday retreated 21.7%,
staying below the 40 days VMA level, indicating that the market is relatively
quiet. (Refer to B).
As noted in C, MACD histogram presented the first signal of technical rebound for KLCI; therefore, we expect the KLCI to further rebound or moving sideways until the MACD histogram shows sign of round top, thus signaling the end of the technical rebound.
Copyright 1997-2005 Straits Index (M) Sdn Bhd, All Rights Reserved