12/05/2005
 (M)
Sdn Bhd
(M)
Sdn Bhd All Rights Reserved.
Composite Index
Daily Technical Analysis, 12/05/2005.
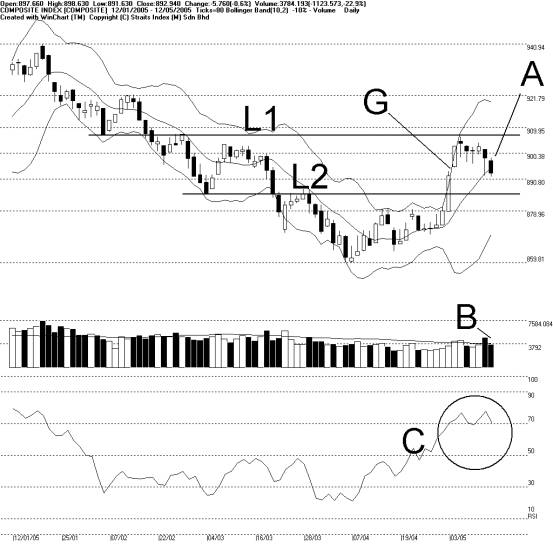
10 days Bollinger Band Width contracted another 10%,
signaling that the KLCI is still consolidating. KLCI indeed was heading at the
target of the 10 days Bollinger Band Middle Band, and even slightly broken below
the middle band. Nevertheless, KLCI is again at a crossed-junction where signals
are unclear, unless Bollinger Band Width opens again. (Refer to A)
For the day, KLCI gave up 5.76 points (-0.6%) with a
support at L2 at 885 points and also 890.8 points of the WinChart Automatic
Fibonacci Retracement. As for the resistance, it is still at L1 resistance at
907.5 points as well as the 900.38 of WinChart Automatic Fibonacci Retracement.
On Tuesday, total market volume was downed 22.9%, below the
40 days VMA. In regards of the gap on last Wednesday (Refer to G), it is now
filled. If we see KLCI standing above the 890.8 support, with the support of
volume, the out look of KLCI should turn bright. Until then, we have no clear
indication of which direction the KLCI is heading to. (Refer to B)
As indicated in C, WinChart RSI remains above the 70% level, mid-term bullish zone. If we see RSI staying above this level, KLCI mid-term sentiment remains bright, and if RSI breaks below 70%, market sentiment will turn to neutral. Although %K of Stochastic has breached below the 70% level, %D remained above 70% giving no confirmation to %K. Therefore, the short-term sentiment of KLCI is cautiously bright.
Copyright 1997-2005 Straits Index (M) Sdn Bhd, All Rights Reserved