10/05/2005
 (M)
Sdn Bhd
(M)
Sdn Bhd All Rights Reserved.
Composite Index
Daily Technical Analysis, 10/05/2005
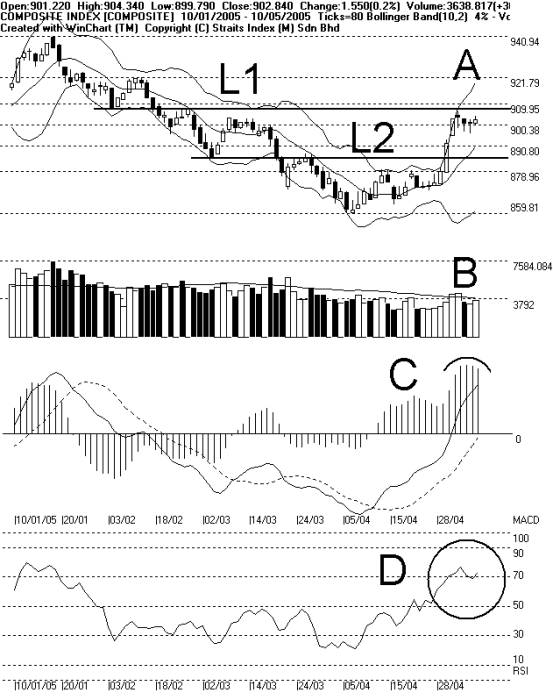
KLCI continued to consolidate on Tuesday, May 10, 2005. As indicated in the chart above, KLCI was supported at the WinChart Automatic Fibonacci Retracement at 900.38 points, and remained range bound in between the L1 resistance at 907.5 points and the L2 support at 885.5 points as well as the important dynamic support of the 10days Bollinger Band middle band. For the day, KLCI gained 1.55 points or 0.2%.
As mentioned on the previous Technical Analysis reports,
KLCI indeed had a pull-back from the 20days Bollinger Band upper band, and it is
now currently targeting at the 10 days Bollinger Band middle band. (Refer to A)
For the day, total volume traded was up 9%, getting closer
to the 40 days Volume Moving Average (VMA). KLCI would be able to continue its
rally under two important conditions. First, the dynamic support of 10 days
Bollinger Band middle band shall not be breached, and second, volume has to be
above the 40 days VMA. (Refer to B).
KLCI current consolidation is confirmed by the MACD
histograms round-top. From a Technical Analysis point of view, sideways
movement of KLCI is the best consolidation to digest the recent over-bought
situation. We shall see an end of the consolidation when the MACD histogram
shows a sign of round bottom. (Refer to C).
In addition, Winchart RSI remains above the 70% level, mid-term Bullish zone, signaling that the current market sentiment remains bullish. Coupled with Stochastic, both %K and %D are situated above the 70% level of short-term Bullish zone, KLCI short-term outlook remains bright.
Copyright 1997-2005 Straits Index (M) Sdn Bhd, All Rights Reserved