03/05/2005年
 (M)
Sdn Bhd
(M)
Sdn Bhd All Rights Reserved.
Composite Index
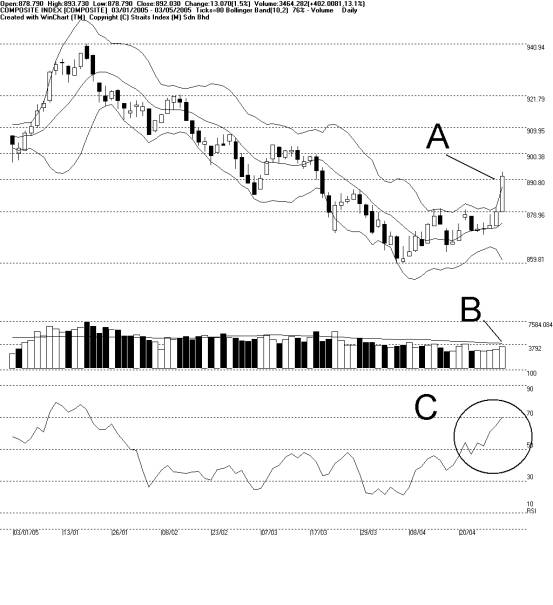
Daily Technical Analysis 03/05/05
KLCI on Tuesday, 03/05/05, had a prevailing day. It opened at last
Fridays close at 787.79 and went up all the way to 898.73 point for the day
high. For the day, KLCI was up 13.07 points (1.5%). As shown in A, KLCI broke
two resistances point of the WinChart Automatic Fibonacci Retracement lines, at
787.96 and 890.8 respectively. Therefore, the current Resistance is at Fibonacci
900.38 while the supports are located at 890.8 points, 878.96, and the dynamic
support of the 10 days Bollinger Band Middle Band.
Volume for the day was up 13.1%, but still below the 40
days VMA. As a result, the uphold of the upside movement of KLCI is doubtful,
unless trading volume of the following days pick up to above 40 days VMA. (Refer
to B)
10 days Bollinger Band opened 76% indicating that the
volatility of KLCI has increased tremendously. Since KLCI is situated above the
Bollinger Middle Band, it shows that the upside movement is likely to continue.
Readers are advised to take note of the 20 days Bollinger Band, where the price
of KLCI has breached above the upper band. Therefore, there would be a pull-back
effect soon, and the target of the pull-back effect should fall around at the 10
days Bollinger Band Middle Band.
WinChart RSI had touched the 70% level. If WinChart RSI breaks above 70%, it will indicate that the KLCI has entered a mid-term bullish zone, thus showing the KLCI is bullish for the mid-term. (Refer to C)
Copyright 1997-2005 Straits Index (M) Sdn Bhd, All Rights Reserved